 Adam Bilsky
Updated :
Adam Bilsky
Updated :
Overview
This report explains the features of the Skills Heat Map. Because it reports exclusively on skills (rather than content) targets, it is most useful for schools that heavily utilize skills targets.
Contents
What it Looks Like
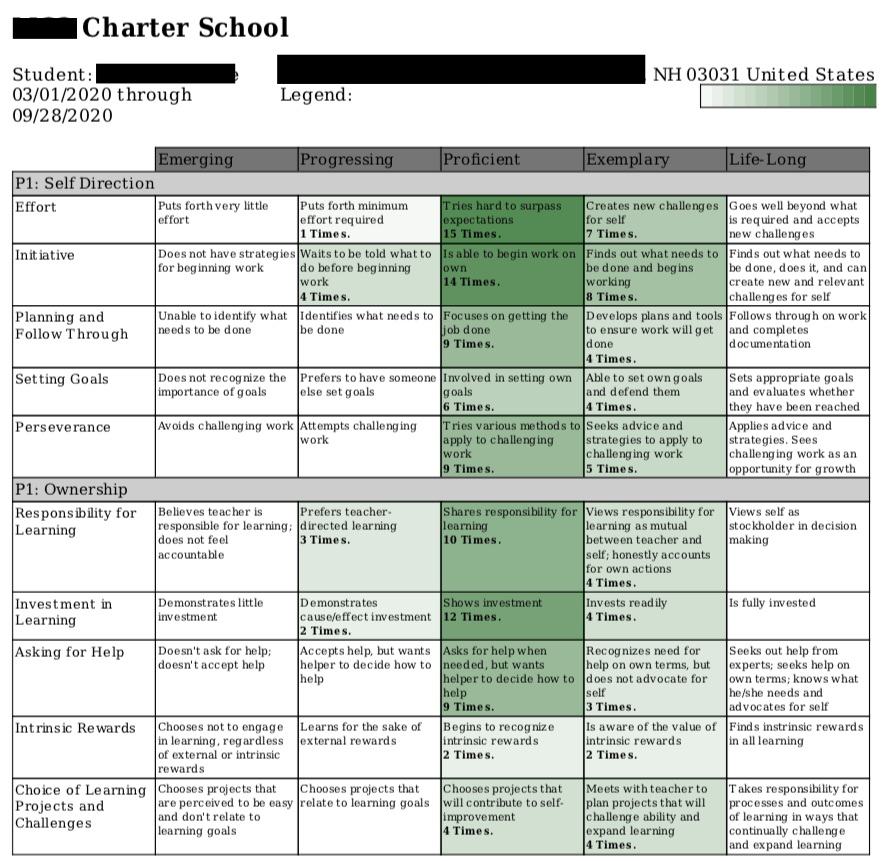
This is what the Skills Heat Map looks like. It is available in only the portrait format:
Report Options
The Skills Heat Map is a relatively simple, time-based report displaying one student per report. After selecting students, indicate the desired date range and click "Generate Report."
Report Sections
This report is essentially a replica of the Performance > Trends page: it shows skills learning targets grouped by subject and subject group, one row per target.
Across the top, the column headers contain the scale marks used to evaluate the targets, starting with the lowest mark at left.
Each cell contains the individual scale mark description, a color, and the number of times the student has earned that particular mark on each skill. Deeper color saturation represents a higher number of marks earned - so the darkest green color indicates the greatest frequency. Thus, in the example above, the student has demonstrated an "Exemplary" level of Initiative (as defined in the cell) a total of 8 times and has earned a "Proficient" mark most frequently overall.
The report does not detail in which experiences the targets and marks were earned in the date range, so the report is most useful for analyzing performance in learning targets. Rather than showing "how much" of a learning plan has been completed, the report highlights "how well" the student has been completing each target.
Suggested Reading
| Note: Articles linked here under "Suggested Reading" are chosen by Foundry Support team members for their relevance and are updated as needed. The articles listed here may differ from those on the right side of the page, where the Knowledge Base AI lists "Related Articles." |
Comments