 Adam Bilsky
Updated :
Adam Bilsky
Updated :
| Note: This article contains video content that will not display or is not optimized to display correctly in the Foundry on-site support widget. For best results, we recommend reading the original in the Knowledge Base. Click the pop-out button |
Estimated read/view time: 6-10 min.
Overview
This article describes how to use the Trends section of the Performance page, which can be accessed by navigating to Advisor > Performance > Trends.
Contents
- Overview Video
- Purpose of the Trends view
- How to interpret the chart
- How to use the page
- Print the Trends page
- The Skills Heatmap Transcript
Overview Video
Purpose of the Trends view
On the Performance page, the Targets view shows you how many targets a student has completed - or how much has been done.
The Trends view, by contrast, shows you how well a student has been doing by organizing the scale marks earned in each subject, target group, or individual target.
The primary functional differences between these two displays are 1) that individual experiences are not listed at the target level, and 2) the graphics and filters for 'completeness' do not show. Since this view is designed to show quality of completed work - rather than quantity - there is no pie chart view, and no buttons for 'Done,' 'Done + Attempted,' or 'To-Do.'
The Trends view can be applied to both content and skills targets. Below is a view of the Skills targets on a sample student's Performance > Trends page:
How to interpret the chart
Across the top, the column headers contain the scale marks used to evaluate the targets, starting with the lowest mark at left.
Like the targets page, each row of the table displays Subject, Subject Group, and Target name. Each cell contains a color and the number of times the student has earned that particular mark on each skill. Deeper color saturation represents a higher number of marks earned - so the darkest green color indicates the greatest frequency. In addition, the presence of a yellow star indicates the most recent mark earned.
Thus, in the (graphic) example above, we can observe the following (just a few examples):
- The student has earned an "Exceeding" mark a total of 2 times on the targetAwareness of Audience, a total of 6 times in the target groupCommunication and Collaboration, and 24 times in the subjectCreative Know-How.
- She has earned the "Meeting" mark most frequently in the subject Creative Know-How - 27 times overall.
- The most recent mark earned on the target Graphic Presentation was "Meeting."
How to use the page
As with the Targets display of the performance page, the page defaults to display the Subject level. You can open to the Target Group level or to the individual Target level using the icons just above the chart.
Unlike the targets page, each individual experience is not listed. Click on any cell in the Trends display to show the experiences in which those targets earned the scale marks, as shown in the video below (no audio):
Print the Trends page
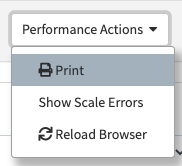
Like all Performance page screens, the information in this page can be printed exactly as shown on your screen by selecting 'Print' from the 'Performance Actions' menu:
The Skills Heatmap Transcript
You can print a similar version of this page as a report from the Quick Actions > Generate Transcripts page - if your site has the Skills Heat Map report loaded. Options include a printout of the Trends view with skills learning targets only. Read here for more information. Most Foundry sites do not come with this transcript option standard, so please contact us at support@projectfoundry.com if you are interested in adding this report to your site.
Suggested Reading
| Note: Articles linked here under "Suggested Reading" are chosen by Foundry Support team members for their relevance and are updated as needed. The articles listed here may differ from those on the right side of the page, where the Knowledge Base AI lists "Related Articles." |
Performance Page: Introduction
Comments